





If your departments report different revenue figures, the best business intelligence tools are the ones that enforce shared definitions—not just build dashboards. Best overall for Microsoft-centered enterprises: Microsoft Power BI; best for visual exploration: Tableau; best for centrally defined metrics: Looker.
- Microsoft Power BI leads the best business intelligence tools shortlist for Microsoft-centered enterprises.
- Tableau suits visual exploration; Looker suits centrally defined metrics and governed reporting.
- Qlik Sense suits associative exploration; SAP Analytics Cloud suits combined analytics and planning.
- Choose enterprise BI around data ownership, reporting workflows, and access controls—not dashboard appearance.
Why this matters
A dashboard does not resolve conflicting definitions of revenue, margin, or pipeline. It makes those conflicts more visible. Before selecting enterprise BI software in 2026, decide which business questions need consistent answers and who owns each definition.
For a construction business, booked work and recognized revenue answer different questions. For a professional services firm, utilization and project margin need different inputs. Your BI platform must preserve those distinctions rather than combine unlike measures into an attractive chart.
Hexagon IT Solutions is a consultation option for businesses choosing how BI should connect to sales and operations. Start with the business problem when discussing your requirements with Hexagon IT Solutions, rather than treating the reporting tool as the entire project.
What makes the best enterprise BI platform?
Use these criteria to judge the shortlist. A platform that fits your reporting team but excludes your operational users is not a complete answer.
- Shared metric definitions: Revenue, active customers, and project margin need documented calculation rules. Prefer an approach that keeps those rules reusable across reports.
- Data access: Check connections to your actual CRM, accounting, operational databases, and data warehouse. Test the required connection mode, not just a connector name.
- Permissions: Confirm how the platform restricts records, reports, exports, and administrative actions. Test access using realistic employee roles.
- Analysis workflow: Distinguish repeatable management reporting from exploratory analysis. A finance pack and an analyst investigation require different interaction patterns.
- Operating ownership: Identify who maintains models, resolves refresh failures, and approves changes. The platform must fit the people responsible for running it.
- Distribution: Decide whether users need browser dashboards, scheduled reports, embedded analytics, or planning workflows. Include external recipients where relevant.
For a 2026 selection, treat these criteria as acceptance conditions. A polished demonstration is useful only when it shows how your team will answer a real business question.
Enterprise BI tools at a glance
The order below reflects distinct buying situations, not a universal performance leaderboard. No platform wins every enterprise workflow.
| Tool | Best for | Standout capability | Key implementation consideration |
|---|---|---|---|
| Microsoft Power BI | Microsoft-centered reporting | Semantic models, DAX, and Power Query | Model design and workspace governance need clear ownership |
| Tableau | Visual exploration | Interactive visual analysis and dashboard authoring | Shared definitions still need deliberate governance |
| Looker | Centrally governed metrics | LookML modeling | Production modeling requires development skills |
| Qlik Sense | Associative exploration | Selections across an associative data model | Relationships and application design require careful preparation |
| SAP Analytics Cloud | Analytics with planning | Reporting and planning within the same platform | Scope and integration requirements need detailed validation |
1. Microsoft Power BI: best for Microsoft-centered reporting
Microsoft Power BI combines data preparation, semantic modeling, and interactive reporting. Power Query handles data transformation, while DAX supports model calculations. Its connections with the broader Microsoft environment make it a practical first shortlist entry for organizations already working there.
The business value comes from reusable reporting logic. Instead of rebuilding the same revenue calculation in separate departmental files, your team can define it in a shared semantic model and use it across reports.
Microsoft Power BI pros:
- Power Query gives report developers a structured way to transform source data.
- Semantic models support reusable measures across multiple reports.
- Row-level security supports access rules based on the underlying data model.
- Microsoft integration provides a relevant starting point for existing Microsoft environments.
Microsoft Power BI considerations:
- DAX and model relationships require specialist knowledge for complex reporting.
- Workspace permissions, content ownership, and publishing practices need explicit governance.
Best for: Enterprises that want standardized management reporting within a Microsoft-centered technology environment.
Ask the implementation team to explain how a change to a revenue measure reaches every dependent report. Also test what happens when a source refresh fails. Those questions reveal operating readiness more clearly than a dashboard demonstration.
For your 2026 shortlist, Microsoft Power BI is the default starting point when Microsoft alignment and repeatable reporting matter most. Verdict: Buy when the pilot confirms your required connections, permissions, and reporting workflow.
2. Tableau: best for visual exploration
Tableau gives analysts an interactive environment for exploring data through visualizations. Users can examine patterns, filter results, and build dashboards that support discussion rather than merely display a fixed report.
That makes Tableau relevant when an analyst needs to investigate why a result changed. A sales leader asking which regions missed target needs a standard view; an analyst investigating the mix of customer segments, products, and deal sizes needs room to explore.
Tableau pros:
- Visual authoring supports iterative investigation of business questions.
- Interactive dashboards let readers examine different slices of a result.
- Tableau supports both live connections and extracts, allowing different data-access approaches.
Tableau considerations:
- Visual flexibility does not replace agreement on business definitions.
- Production deployments still require ownership of published data sources and workbook changes.
Best for: Analyst-led teams where visual investigation is a central part of decision-making.
Give Tableau evaluators a question with several plausible explanations, such as a margin decline across projects. Ask them to separate changes in revenue mix from changes in delivery costs. Judge whether the analysis remains understandable when another employee takes over.
The result should be a repeatable investigation, not a dashboard that only its author understands. Verdict: Buy for visual analysis when the pilot also proves data-source governance and a clear handover process.
3. Looker: best for centrally defined business metrics
Looker uses LookML to describe data relationships and business logic in a modeling layer. Users then explore data through that model. The approach suits organizations that want centrally maintained definitions rather than calculations scattered across reports.
The business outcome is consistency. If finance and sales use the same approved definition of recognized revenue, discussions can focus on performance rather than reconciling different calculations.
Looker pros:
- LookML provides an explicit place to maintain reusable business logic.
- The model supports governed exploration rather than requiring every user to write SQL.
- Embedded analytics supports reporting experiences within other applications.
Looker considerations:
- Model development requires people comfortable with SQL and LookML.
- Query performance depends on the model, generated queries, and underlying database environment.
Best for: Enterprises with a data warehouse and a technical team responsible for shared metric definitions.
Do not confuse Looker with Looker Studio; they are distinct products. Specify which product you are evaluating in procurement documents, architecture discussions, and pilot requirements.
For a 2026 evaluation, ask Looker developers to change a shared metric and demonstrate the approval process. Then check the downstream reports. Verdict: Buy when centralized modeling is a deliberate operating choice and you have the team to maintain it.
4. Qlik Sense: best for associative data exploration
Qlik Sense uses an associative data model to help users examine relationships across connected data. Selections show associated and excluded values, giving investigators another way to inspect what contributes to a result.
This approach fits questions that do not follow a predictable drill-down path. An operations analyst investigating delivery exceptions might need to move between suppliers, locations, products, and order records as the investigation develops.
Qlik Sense pros:
- Associative selections support exploration across connected business dimensions.
- Associated and excluded values provide context during an investigation.
- Interactive applications can present several views of the same operational question.
Qlik Sense considerations:
- Incorrect associations can undermine the meaning of the analysis.
- Application design and data preparation need dedicated ownership.
Best for: Operations and analytics teams investigating relationships across multiple business dimensions.
Use a pilot question that requires switching direction during analysis. Ask the team to explain an exception, identify related records, and show which records fall outside the current selection. Include an operational user, not only a developer, in that exercise.
Qlik Sense belongs on the shortlist when associative investigation matches how your users work. Verdict: Buy when users can explain the selections and the data team can maintain the relationships behind them.
5. SAP Analytics Cloud: best for analytics and planning together
SAP Analytics Cloud combines business intelligence and planning capabilities. It fits evaluations where leadership needs to analyze performance and work with plans or forecasts rather than distribute dashboards alone.
The distinction matters for finance-led projects. Reviewing actual performance and entering a revised forecast are related activities, but they have different requirements for write access, approval, and version control.
SAP Analytics Cloud pros:
- Analytics and planning capabilities support related management workflows.
- SAP connectivity makes it relevant to organizations evaluating reporting around SAP systems.
- Planning models support structured work with budgets and forecasts.
SAP Analytics Cloud considerations:
- Connection choices and supported workflows require validation against your specific source systems.
- Planning adds model ownership, access rules, and process requirements beyond dashboard delivery.
Best for: Finance-led enterprises that need analytics and planning in the same platform, particularly when SAP integration is central.
Demonstrate the complete workflow: review actuals, update a plan, apply permissions, and compare versions. Do not accept a reporting demonstration as proof that the planning process fits your organization.
Treat reporting and planning as separate acceptance tests within the same evaluation. Verdict: Buy when both workflows pass; hold if the requirement is only straightforward dashboard distribution.
How we ranked these enterprise BI tools
The ranking uses the selection criteria above: metric consistency, data access, permissions, analysis workflow, operating ownership, and distribution. It assigns each platform a distinct use case based on established product capabilities, not an invented benchmark or hands-on test score.
Microsoft Power BI takes the default slot for Microsoft-centered reporting. Tableau, Looker, Qlik Sense, and SAP Analytics Cloud take narrower slots where their respective analysis or modeling approaches fit the requirement. Your architecture and staff determine the final choice.
Run a pilot before committing
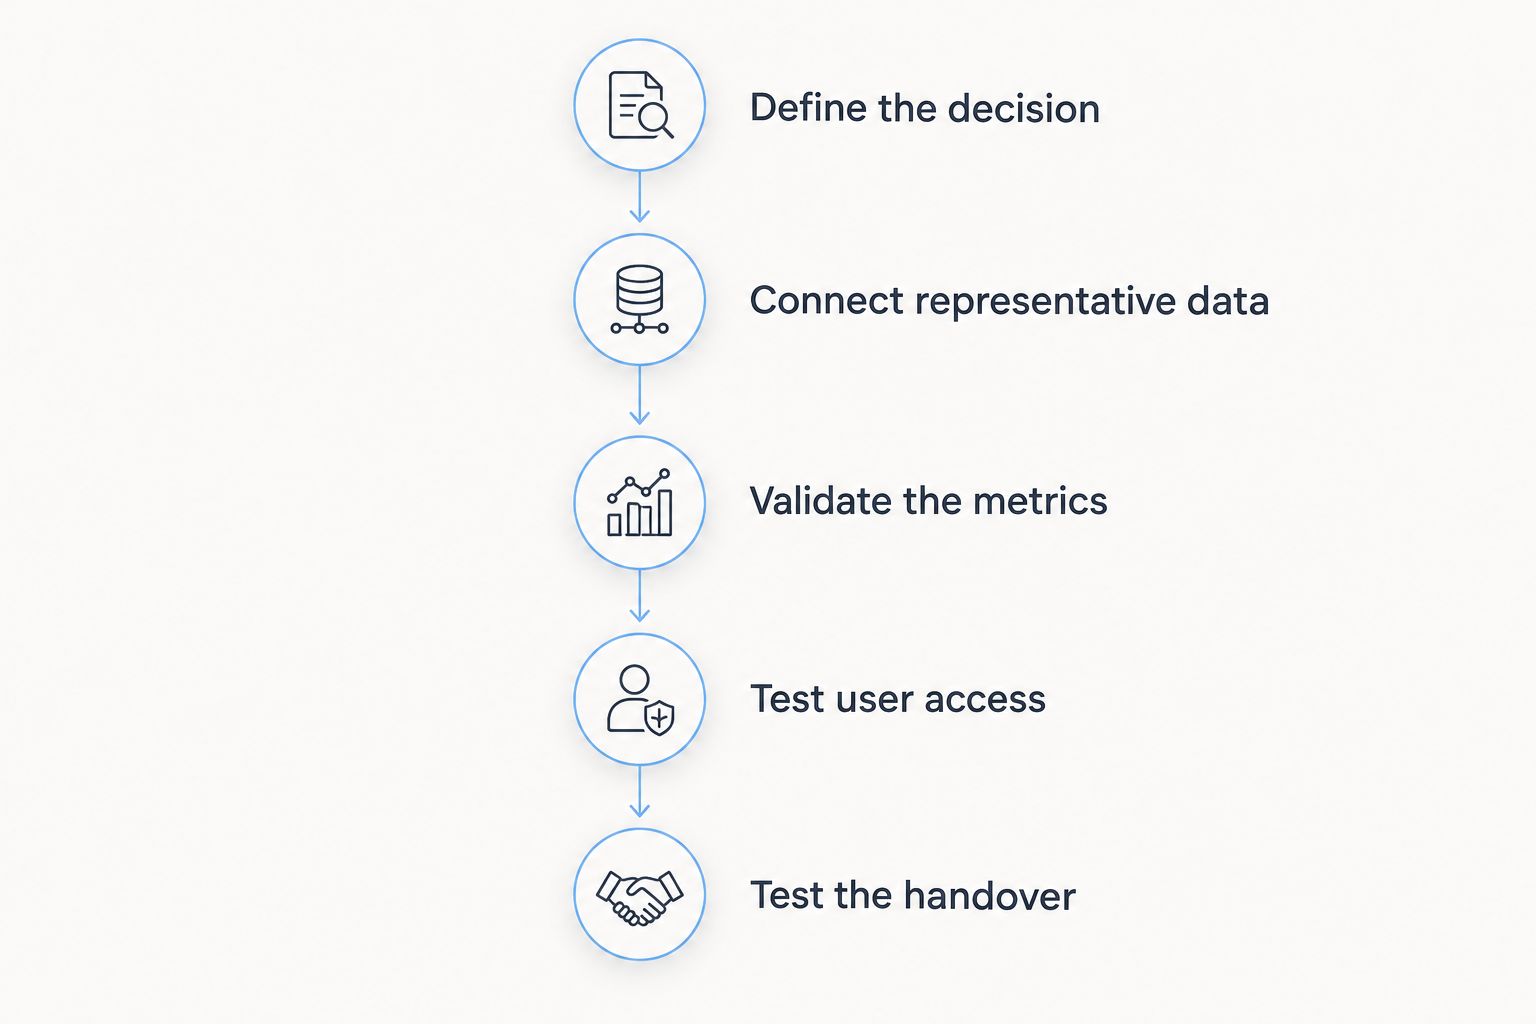
Use a 30-day pilot as a proposed evaluation window, not a promised deployment timeline. In 2026, the most useful shortlist test is a complete reporting workflow with real permissions and a named owner.
Define the decision
Pick one question tied to action: which projects need a margin review, which accounts need attention, or which branches need an operational intervention. Write down who acts on the answer. Avoid beginning with a request to recreate every existing spreadsheet.
Connect representative data
Start with 3 source systems that reflect the intended workflow, such as CRM, finance, and project operations. This is a pilot design recommendation, not a minimum platform requirement. Include inconsistent identifiers and missing records rather than presenting only cleaned demonstration data.
Validate the metrics
Give each calculation a business owner. Document exclusions, timing rules, and the treatment of corrections. Reconcile the dashboard against a reference report before judging appearance.
Test user access
Use actual job roles to test record visibility, report access, and exports. Include a manager who needs aggregate information but should not see every underlying record. Verify restrictions through use, not screenshots of permission settings.
Test the handover
Reserve a 2-hour handover session for someone who did not build the report. Ask that person to update a definition, diagnose a failed refresh, and identify the support owner. An unexplained dependency on the original developer is an operating problem.
Which business intelligence tool should you choose?
Choose Microsoft Power BI as your first evaluation when your enterprise centers on Microsoft and needs repeatable reporting. Choose Tableau for visual investigation, Looker for centrally maintained metrics, Qlik Sense for associative exploration, or SAP Analytics Cloud for analytics with planning.
For a 2026 procurement decision, require evidence that the platform answers your chosen question, respects permissions, and survives a handover. Treat an unresolved failure in any of those areas as a reason to pause the purchase.
FAQ
What's the best business intelligence tool for an enterprise?
Microsoft Power BI is the first shortlist choice for a Microsoft-centered enterprise that needs standardized reporting. Tableau, Looker, Qlik Sense, and SAP Analytics Cloud fit different analysis, modeling, and planning requirements.
Is Power BI or Tableau better for business reporting?
Power BI is the stronger starting point for Microsoft-centered reporting, while Tableau fits teams prioritizing visual exploration. Evaluate both with the same business question, source data, and permission requirements.
When should an enterprise choose Looker?
Choose Looker when centrally defined metrics and a maintained modeling layer are core requirements. The organization needs SQL and LookML skills to develop and operate that model.
Do enterprise BI tools replace a CRM or ERP?
Enterprise BI tools do not replace the operational functions of a CRM or ERP. They analyze data from those systems, while transactional workflows remain in the systems responsible for them.
How should we evaluate enterprise BI software in 2026?
Evaluate enterprise BI software in 2026 with a business-led pilot that tests calculations, connections, permissions, and handover. Assign owners before testing so every acceptance condition has someone responsible for approving it.
One last thing
A dashboard can refresh successfully and still answer the wrong question. Before approving it, ask the business owner to explain what action follows from a change in each key metric. If nobody can name the action, remove that metric from the first release.
Related guides
- Best API integration platforms for businesses
- Best CRM software for small businesses
- Best construction management software
- Best digital transformation consulting firms
Schedule a consultation with Hexagon IT Solutions to discuss your BI requirements and integration priorities.
Discuss your BI requirements
Start with your reporting decisions, source systems, and ownership requirements.


